The Erlang global Livelock: A 34-Million-Iteration Bug
We ran into an issue where a 45-node Couchbase Server cluster ran out of memory on multiple nodes at a customer site. The nodes were running OTP 25.3. The nodes that ran out of memory were OOM-killed, and the disk filled while writing 60-100 GiB crash dumps, so when they restarted, the process state was lost. The root cause was a 34-million iteration livelock in global. This is how I traced it without a reproduction, using the other nodes’ logs.
Day 1
The first step was figuring out which process(es) were consuming memory. The memory consumption was in ns_server, but nothing noteworthy was happening at the time that memory consumption spiked. Prometheus statistics revealed nothing. I came across memsup data in a text log. memsup records memory usage for top Erlang consumers every minute. I parsed and plotted memsup data from the one node Support had mentioned, and sure enough, there was a single offender, a process <0.56.0>. The memory consumed by the <0.56.0> process increased linearly.
Day 2
I plotted the worst memory offender from memsup data on all nodes in the cluster. <0.56.0> was the culprit on all affected nodes.
It wasn’t immediately obvious what this process <0.56.0> referred to, so I spun up a node running the identical Couchbase Server version. <0.56.0> was a process registered by global.
global is a module that is responsible for registering names on the network of nodes running the Erlang distribution protocol. It’s part of the Erlang kernel and runs whether you use it or not. From the Erlang documentation:
The global name server also performs the critical task of continuously monitoring changes in node configuration. If a node that runs a globally registered process goes down, the name is globally unregistered. To this end, the global name server subscribes to
nodeupandnodedownmessages sent from modulenet_kernel.
This is an Erlang kernel process that we hadn’t tweaked. We don’t use it for process registration either.
I filtered the logs for global function hits. One stack on node-0082 caught my attention: it contained a few messages – cancel, remove_from_known, his_the_locker – in its mailbox. I suspected that the message queues for the process <0.56.0> spawned by global grew indefinitely on the nodes that ran out of memory – perhaps, there was a livelock.
The trigger was unclear. Since global responds to nodeup and nodedown messages, I suspected there were network issues causing repeated node flaps. I had noticed that the nodes occasionally restarted hundreds of times. Perhaps, the connection churn exposed a race condition in global.
Support told me there were no network issues but that a Kubernetes upgrade had been initiated on some nodes. However, the OOM wasn’t limited to nodes that were upgraded. Nor was it the case that every node that was upgraded ran into this issue. It was unclear whether the upgrade had anything to do with it.
Day 3
We record diagnostic info in cbcollect dumps, which captures Erlang process info for all running processes, including their mailbox contents. I had stopped looking at process dumps after the first handful – their process state was clean as the nodes had restarted. A colleague flagged a node that still had its process dump intact. Its memory usage had increased but hadn’t run out, unlike the other nodes. They’d opened the dump and said it appeared to confirm my hypothesis – the mailbox contained 69M messages:
{message_queue_len,69628685},The message queue contained alternating cancel and his_the_locker messages with monotonically increasing tags, stepping by 1 each pair:
{messages,
[<<"{cancel,'ns_1@node-85',-576460752302537370,no_fun}">>,
<<"{his_the_locker,<18602.56.0>,{8,[]},-576460752303387318,-576460752302537369}">>,
<<"{cancel,'ns_1@node-85',-576460752302537369,no_fun}">>,
<<"{his_the_locker,<18602.56.0>,{8,[]},-576460752303387317,-576460752302537368}">>,
<<"{cancel,'ns_1@node-85',-576460752302537368,no_fun}">>,
<<"{his_the_locker,<18602.56.0>,{8,[]},-576460752303387316,-576460752302537367}">>,
<<"{cancel,'ns_1@node-85',-576460752302537367,no_fun}">>,
<<"{his_the_locker,<18602.56.0>,{8,[]},-576460752303387315,-576460752302537366}">>,
<<"{cancel,'ns_1@node-85',-576460752302537366,no_fun}">>,
<<"{his_the_locker,<18602.56.0>,{8,[]},-576460752303387314,-576460752302537365}">>]}
This sequence of messages suggested that two nodes were caught in a loop where they repeatedly attempted to establish new sessions – each new session minting a new tag, one larger than the one previously used.
From <0.55.0>’s process dictionary on node 74:
{{sync_tag_my, 'ns_1@node-85'}, -576460752267720345},
{{sync_tag_his, 'ns_1@node-85'}, -576460752268570427},
The difference between the current tag in the dictionary and the tags in the message queue gave the iteration count: 576460752303387318 - 576460752268570427 = ~34M tags, with two messages per iteration (his_the_locker + cancel) producing the 69M message total.
34M synchronization sessions had begun between this pair of nodes. I started looking at the global source code to understand the synchronization protocol.
I noticed the assumptions mentioned in global.erl lines 793-799:
%% In case a connection goes down and then up again, the
%% 'nodedown' for the old connection is nowadays guaranteed to
%% be delivered before the 'nodeup' for the new connection.
%%
%% By keeping track of connection_id for all connections we
%% can differentiate between different instances of connections
%% to the same node.
I wondered if the ordering of nodeup and nodedown was violated somehow.
I filed an initial bug report containing the mailbox trace with Erlang/OTP.
Separately, QA tried to reproduce the issue with Kubernetes upgrades and repeated node restarts in a large cluster, but their attempts were unsuccessful.
Day 7
Reading further into the source, I found a comment about vsn 8:
%% Vsn 8 - "verify connection" part of the protocol preventing
%%         deadlocks in connection setup due to locker processes
%%         being out of sync
global vsn 8 of the protocol introduced reconnect attempts when the locker processes on the nodes were out of sync. I didn’t see any rate control limits in the connection attempts. I suspected that the locker processes were out of sync and flooded each other with repeated handshake attempts.
How could this be related to upgrades?
When a Kubernetes node was upgraded, the Couchbase pods running on it were evicted and flagged for auto-failover since they became unreachable. Couchbase Autonomous Operator repeatedly recreated these failed pods but detected their state as unhealthy (since they had been failed over without its knowledge) until the pod was successfully added back to the Couchbase cluster. Each pod restart corresponded to an Erlang node restart with the same Couchbase node name, though the pod’s network identity likely changed – triggering net_kernel’s nodeup and nodedown messages. global triggered new synchronization session attempts in response to these messages. As soon as the pod stabilized and established connections successfully, the memory on a pair of Couchbase nodes increased linearly. My theory was that the handshake after upgrade caused some upgraded nodes to get stuck in a bad state, leading to indefinite retries and eventual OOM.
The vsn 8 retry logic meant that sync sessions initiated at the time of upgrade might be interrupted by repeated restarts and retried indefinitely – with no rate limit.
This was confirmed by the memory plot: pairs of nodes consumed memory in lockstep and coincided with the time of upgrade.
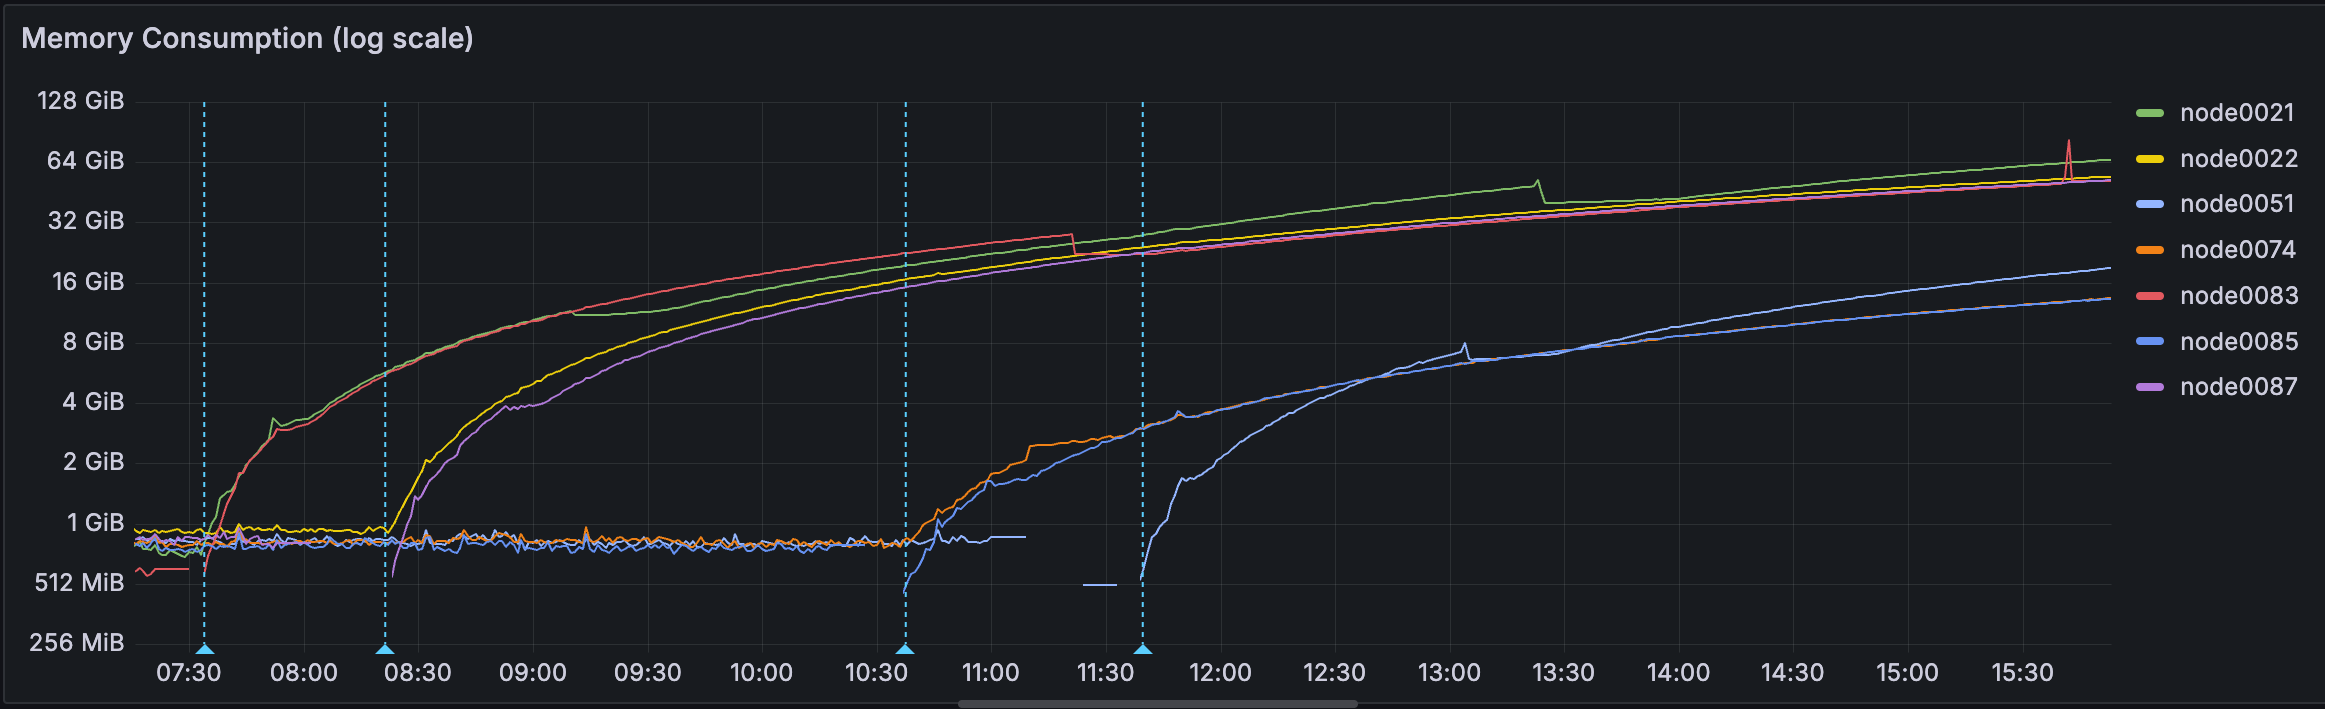
I had a separate concern: when the session was stuck, could it lead to locks not being released?
Any locks held are logged in global‘s ETS tables. I parsed the global-related ETS dumps in the cbcollect dumps and concluded that a lock held by one of the first two nodes in the message storm (at 7:30 am in the diagram above) hadn’t been released – and that this unreleased lock potentially stalled other nodes’ synchronization attempts.
I posted an update on the OTP ticket with these findings.
Day 8
Since I hadn’t received any updates on the ticket, I looked further at the vsn 8 protocol, specifically the sequence of init_connect and cancel_connect messages during retries.
I noticed this in the retry path:
%% This should not be possible unless global group has
%% been configured. We got an already ongoing connection
%% setup with Node and get yet another connection attempt
%% from Node.
I was curious what would happen if it did hit this condition.
When Node B sends an init_connect to Node A, it includes a session tag HisTag, which identifies this sync attempt. If Node A already has Node B in its pending list (an ongoing sync session that’s in progress), Node A should cancel the old session, restart cleanly, and throw – discarding the old session with HisTag entirely.
Without the throw, execution falls through. Node A has just called restart_connect, which wiped Node B’s state and started a fresh sync session with a new tag MyTag + 1. But then the fall-through code saves Node B’s canceled HisTag as if it were the current session (identified by the pair HisTag, MyTag + 1).
From Node B’s perspective: it received a cancel_connect for the HisTag session, so it discards the old session, mints a new tag and sends a new init_connect with HisTag + 1. Node A now finds Node B in its pending list again – because the fall-through set it incorrectly – and the cycle repeats.
One missing throw. 34 million iterations.
When Node B is upgraded and rejoins the cluster, it sends init_connect to establish a new sync session with Node A. If Node A already has Node B in its pending list from a prior attempt, this is what happens:
sequenceDiagram
    participant B as Node B
    participant A as Node A (global_name_server)
    participant L as Node A (locker)

    B->>A: init_connect(HisTag)
    Note over A: {pending, B} already set
    A->>B: cancel_connect(HisTag)
    Note over A: restart_connect(MyTag)
    Note over A: {pending, B} cleared
    A->>L: {cancel, B, MyTag, no_fun}
    Note over A: handle_nodeup → MyTag+1
    A->>B: init_connect(MyTag+1)
    Note over A: missing throw -- falls through
    A->>L: {his_the_locker, B_locker, HisTag, MyTag+1}
    A->>B: init_connect_ack(HisTag, MyTag+1)
    Note over A: {pending, B} set again
    Note over B: cancel_connect → restart → HisTag+1
    B->>A: init_connect(HisTag+1)
    Note over A: {pending, B} -- repeat ↑
Each loop iteration deposits this pair into A’s locker mailbox:
Abstract                                    node0074 production values
--------------------------------------------------------------------------
{cancel, B,       MyTag,   no_fun}     ->  {cancel,'ns_1@node-85', -576460752302537370, no_fun}
{his_the_locker,                       ->  {his_the_locker,
  B_locker,                                 <18602.56.0>,
  {8,[]},                                   {8,[]},
  HisTag,                                   -576460752303387318,
  MyTag+1}                                  -576460752302537369}
Next iteration: MyTag+1 becomes MyTag, HisTag+1 arrives from B.
I posted an update on the ticket: Should there be a throw after the restart_connect?
Day 14
Rickard, an OTP maintainer, confirmed, “Great find!” He asked if we had global_groups configured and why the connections kept going up and down.
Neither of us had the full picture yet.
Day 21
Since we weren’t able to reproduce the issue, there was some reluctance in pushing a speculative fix. Unfortunately, the customer ran into the issue again.
The open question: How could an init_connect arrive while a connection was marked pending?
Was it possible that a global init_connect message arrived before the nodeup from net_kernel? This seemed highly unlikely based on the comments here:
%% Monitor all 'nodeup'/'nodedown' messages of visible nodes.
%% In case
%%
%% * no global group is configured, we use these as is. This
%% way we know that 'nodeup' comes before any traffic from
%% the node on the newly established connection and 'nodedown'
%% comes after any traffic on this connection from the node.
and the net_kernel delivery guarantees:
Delivery guarantees of nodeup/nodedown messages:
nodeupmessages are delivered before delivery of any signals from the remote node through the newly established connection.nodedownmessages are delivered after all the signals from the remote node over the connection have been delivered.nodeupmessages are delivered after the corresponding node appears in results fromerlang:nodes().nodedownmessages are delivered after the corresponding node has disappeared in results fromerlang:nodes(). As of OTP 23.0, anodedownmessage for a connection being taken down will be delivered before anodeupmessage due to a new connection to the same node. Prior to OTP 23.0, this was not guaranteed to be the case.
The nodeup/nodedown sequence in the logs was consistent – I didn’t have visibility into init_connect, but nothing in the net_kernel events suggested ordering anomalies.
I pivoted to looking at how network connections were created and destroyed during a Kubernetes upgrade. The presence of wait_pending in the net_kernel logs seemed odd. I looked it up. wait_pending revealed that the old connection was still alive when the new one completed its handshake – net_kernel only kills the old controller at that point. This meant messages from the old session could be delivered on the new connection, unlike a clean FIN/RST disconnect where the old connection is gone before the new one is established. This might have exposed a corner condition in global. During handle_nodedown, a send_cancel_connect_message uses erlang:send({global_name_server, Node}, Msg, [noconnect]) – it silently drops if there’s no connection. With wait_pending, the new connection is already established when nodedown fires – that’s what triggers the teardown – so the cancel goes through instead of being silently dropped.
Building on this, I wondered if tags were recycled during pod restarts, and whether they could collide and confuse global. I spun up Erlang VMs repeatedly and noticed that erlang:unique_integer([monotonic]) always starts from the same number (?MIN_64BIT_SMALL_INT). This implied that repeated restarts of Node B after an upgrade could reuse tags used in previous incarnations. Might this expose a corner case in conjunction with wait_pending?
I established a packet sequence that could lead to the condition where Node A determined that it already had a connection when the init_connect was processed.
- A had an in-flight sync session with B’s previous life using tag T
- B restarts and begins a new connection attempt, minting the same tag T from scratch
- Because connection termination is delayed until the new connection is accepted, a TCP connection already exists when the
nodedownis delivered to A. In response, A sendscancel_connect(T)– and because B is reachable, it goes through. In the common case, the old connection is already gone before the new one is established, so the cancel is silently dropped and B’s new life never sees it. - B recognizes
cancel_connect(T)as valid – the tag matches its ownsync_tag_my– and restarts withT+1. (If it hadn’t matched, it would be silently discarded.)
Consequently, A gets two init_connect messages from B, the second when it already has B in pending state.
sequenceDiagram
    participant A as A
    participant B as B (new life, tag=T)

    Note over A: mailbox: [nodedown(B), nodeup(B)]
    Note over B: New connection fully established
    Note over B: nodeup(A) fires
    B->>A: init_connect(T)
    Note over A: processing nodedown(B) -- old session tag = T (B's previous life)
    A->>B: cancel_connect(T) -- B is reachable, send goes through
    Note over B: sync_tag_my = T -- T == T? Yes, restart fires
    B->>A: init_connect(T+1)
    Note over A: processing nodeup(B)
    Note over A: processing init_connect(T) -> {pending, B}
    Note over A: processing init_connect(T+1) -- {pending,B} set -> livelock
I was not able to reproduce this specific condition, but pushed the speculative fix (the missing throw) to the customer. The issue hasn’t recurred. Rickard fixed it upstream in OTP shortly after.
Conclusion
The missing throw is the confirmed bug: once two nodes ended up in the state where {pending, B} was already set when a new init_connect arrived, the livelock was inevitable – unbounded retries, no error logged, memory growing silently. Each iteration deposited exactly the alternating cancel and his_the_locker pairs found in the production mailbox – 34M iterations, two messages each, 69M total.
What’s less certain is how that precondition arose. The most plausible path involves two things coinciding: wait_pending delaying teardown of the old connection long enough for messages from the old global synchronization session to be delivered on the new one, combined with tag reuse – every Erlang VM starts minting tags from ?MIN_64BIT_SMALL_INT on boot, so a restarted pod can issue a tag that collides with one the peer still has in flight from the pod’s previous incarnation. I wasn’t able to reproduce this specific sequence, but the fix held.
his_the_locker, HisTag, and related names appear verbatim from the Erlang source.
References
- OTP issue: erlang/otp#9117 – filed Nov 26, 2024, assigned to Rickard Green (OTP maintainer)
- Affected version: OTP 25.3
- Fixed in: OTP 25.3.2.17
- Relevant source:
lib/kernel/src/global.erl